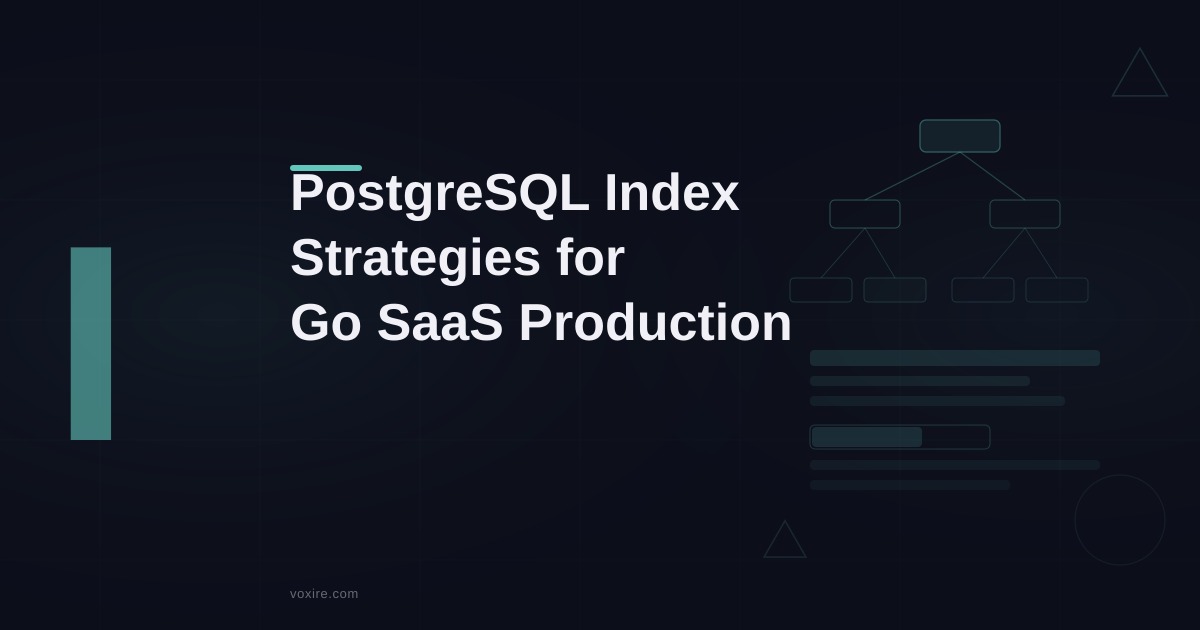
Most PostgreSQL performance problems in SaaS backends are not caused by missing indexes. They are caused by wrong indexes, unused indexes, and queries that ignore the indexes that already exist. Here is how we actually diagnose and fix this in production Go services.
Most PostgreSQL performance problems in SaaS backends are not caused by missing indexes. They are caused by wrong indexes, unused indexes, and queries that ignore the indexes that already exist. Here is how we actually diagnose and fix this in production Go services running on AWS ECS in Lebanon and across the MENA region.
Why adding an index does not always fix slow queries
The first instinct when a query is slow is to add an index on the filtered column. Sometimes it works. More often, you add the index and the query is still slow, or it gets slower on writes without getting meaningfully faster on reads.
The problem is that PostgreSQL decides whether to use an index based on the query planner's cost estimates. If your table has 800 rows in staging but 2.4 million rows in production, the planner may correctly ignore an index in staging and correctly use it in production. Or it may get the statistics wrong and make the wrong choice either way.
Before touching any index, the right first step is to read the actual query plan, not the estimated one.
EXPLAIN (ANALYZE, BUFFERS, FORMAT TEXT)
SELECT id, status, created_at
FROM orders
WHERE tenant_id = $1
  AND status = 'pending'
ORDER BY created_at DESC
LIMIT 50;
The BUFFERS option shows how many pages were read from disk versus served from the shared buffer cache. If you see Buffers: shared read=18000 on a query that returns 50 rows, you have a real problem. If you see Buffers: shared hit=12, the query is already pulling from cache and an index is unlikely to help meaningfully.
The B-tree index cases that actually matter
B-tree is the default index type and it handles equality, range queries, and sorting. The decisions that matter in SaaS workloads are not whether to use B-tree but how to structure the key columns.
Column order is not obvious. Most engineers put the highest-cardinality column first because they were told that is correct. In multi-tenant SaaS it is usually wrong. Your queries almost always filter by tenant_id first. Even if tenant_id has low cardinality across the whole table, putting it first in the index narrows the scan to one tenant's data before applying the high-cardinality filter. See also: Implementing SaaS Pricing Tiers in Go with PostgreSQL for the topic-specific playbook. See also: PostgreSQL Backup and Point-in-Time Recovery for Production SaaS for the topic-specific playbook. See also: Circuit Breakers and Graceful Degradation for Go SaaS Backends for the topic-specific playbook.
-- Common mistake: status has high cardinality, tenant_id low
CREATE INDEX idx_orders_status ON orders(status, tenant_id, created_at);

-- Better for multi-tenant SaaS workloads
CREATE INDEX idx_orders_tenant_status_time ON orders(tenant_id, status, created_at DESC);
With the second index, a query filtering on tenant_id = 42 AND status = 'pending' ORDER BY created_at DESC can do an index-only scan on a tiny slice of data. With the first index, it scans all pending orders across all tenants and then filters by tenant.
The sort direction matters. PostgreSQL can scan indexes backward, but mixing ASC and DESC columns in a single index is handled differently across versions. For Go APIs that consistently sort newest-first, adding DESC to the time column in the index can eliminate an explicit sort step in the query plan.
Partial indexes: the most underused optimization in SaaS backends
A partial index only covers rows where a condition is true. In SaaS products, most operational queries touch a small subset of rows. Jobs that are pending. Orders that are unprocessed. Subscriptions that are active. Building a full index on all rows is wasteful.
-- Index only the rows that queries actually touch
CREATE INDEX idx_jobs_pending ON background_jobs(tenant_id, scheduled_at)
WHERE status = 'pending';

CREATE INDEX idx_subs_active ON subscriptions(tenant_id, renewal_date)
WHERE status = 'active';
In a billing system we run for a SaaS client with around 40,000 subscriptions, only about 12% are active at any given time. The partial index on active subscriptions is roughly one tenth the size of a full index. It fits in PostgreSQL's buffer cache, eliminating disk reads entirely for the renewal processing job that runs nightly.
For the Go side, nothing changes. The same query hits the right index automatically when the WHERE clause matches the partial index condition:
rows, err := db.QueryContext(ctx,
  `SELECT id, tenant_id, renewal_date
   FROM subscriptions
   WHERE status = 'active'
     AND renewal_date < $1`,
  tomorrow,
)
PostgreSQL sees that status = 'active' is in the query and the planner picks the partial index over a full table scan.
Covering indexes and index-only scans
Every time a query needs a column that is not in the index, PostgreSQL does a heap fetch: it follows a pointer from the index entry back to the actual table page. At scale, heap fetches are expensive. If your query returns only columns that are already in the index, PostgreSQL can skip the heap entirely.
-- Index includes all columns the query needs
CREATE INDEX idx_orders_tenant_list ON orders(tenant_id, status, created_at DESC)
INCLUDE (id, total_amount, customer_id);
The INCLUDE columns are stored in the leaf nodes of the B-tree but not in the internal nodes. This keeps the index compact while enabling index-only scans for list queries that need id, total, and customer without touching the heap.
In EXPLAIN output, look for Index Only Scan instead of Index Scan. The difference in heap fetches shows up in the BUFFERS output. On a busy table in production, converting a hot list query from an Index Scan to an Index Only Scan can cut query time by 60% to 80%.
GIN indexes for JSONB and array columns
Some SaaS products store flexible metadata in JSONB columns. Operators want to filter by arbitrary metadata fields without schema changes. B-tree indexes do not work for JSONB key-value lookup. GIN indexes do.
CREATE INDEX idx_products_metadata ON products USING GIN(metadata);

-- Now this query can use the GIN index
SELECT id, name FROM products
WHERE metadata @> '{"category": "frozen", "supplier_id": 14}'::jsonb;
GIN indexes are larger and slower to update than B-tree. They are appropriate when JSONB filtering is frequent and the metadata structure is unpredictable. If the metadata always has the same keys, extracting those into real columns and using B-tree is almost always better.
Finding unused and duplicate indexes in production
Every index has a write cost. INSERT, UPDATE, and DELETE operations must update every index on the table. In high-write SaaS workloads, a table with eight indexes on it can be significantly slower to write to than the same table with three well-chosen indexes.
PostgreSQL tracks index usage in pg_stat_user_indexes. After a system has been running under production load for a few weeks, check which indexes are never scanned:
SELECT
  schemaname,
  tablename,
  indexname,
  idx_scan,
  idx_tup_read,
  idx_tup_fetch
FROM pg_stat_user_indexes
WHERE idx_scan = 0
  AND schemaname = 'public'
ORDER BY tablename;
Any index with idx_scan = 0 after weeks of real traffic is never being used. Before dropping it, check whether it was recently created or whether there is a specific batch job that runs monthly that might be the only user. But if it has been ignored across a full billing cycle, it is safe to drop.
For duplicate indexes, look at indexes where one is a prefix of another on the same table:
SELECT
  a.indexname AS index_a,
  b.indexname AS index_b,
  a.tablename
FROM pg_indexes a
JOIN pg_indexes b
  ON a.tablename = b.tablename
  AND a.indexname <> b.indexname
  AND a.indexdef LIKE b.indexdef || '%'
WHERE a.schemaname = 'public';
In practice, duplicate indexes accumulate during rapid development. Developers add indexes for specific queries without checking whether a composite index already covers that column as its first key.
Using EXPLAIN output in Go development workflows
In Go service development, the workflow for diagnosing slow queries is:
- Catch slow queries with
pg_stat_statements- setlog_min_duration_statement = 200in PostgreSQL config to log any query over 200ms. - Run EXPLAIN ANALYZE on the slow query directly against a production read replica or a production-scale dataset.
- Look for Seq Scans on large tables, high heap fetches, sort operations that could be eliminated with an ordered index.
- Add the minimal index change and test on a staging environment seeded with production-scale data.
For the Go application layer, we use sqlc-generated queries in our Go SaaS backends. The query text is static and predictable, which makes it straightforward to take any query from the generated code and run EXPLAIN on it directly. When queries are dynamically built, finding the actual SQL for a slow query is harder.
A helper we use in local development drops the query plan to the log:
func explainQuery(ctx context.Context, db *sql.DB, query string, args ...any) {
  rows, err := db.QueryContext(ctx, "EXPLAIN (ANALYZE, BUFFERS) "+query, args...)
  if err != nil {
    log.Printf("EXPLAIN failed: %v", err)
    return
  }
  defer rows.Close()
  for rows.Next() {
    var line string
    rows.Scan(&line)
    log.Println(line)
  }
}
This is only for development diagnostics, never production, since EXPLAIN ANALYZE actually executes the query.
Key lessons from production
Index strategy in SaaS PostgreSQL backends comes down to a few reliable patterns:
- Always filter by
tenant_idfirst in composite indexes for multi-tenant systems. - Use partial indexes on operational subsets: pending jobs, active subscriptions, unprocessed events.
- Use INCLUDE columns to enable index-only scans on hot list queries.
- Check
pg_stat_user_indexesafter real traffic runs and drop indexes with zero scans. - Never trust staging query plans for production performance; staging tables are too small.
- GIN indexes are for JSONB and arrays; everything else is B-tree until proven otherwise.
PostgreSQL's query planner is good, but it needs accurate statistics and well-structured indexes to make good decisions. Running ANALYZE after large bulk loads and tuning autovacuum settings on high-write tables keeps the planner estimates accurate.
Enjoying this article?
Enter your email and get a clean, formatted PDF of this article: free, no spam.
Not sure where to start?
Voxire builds and operates Go SaaS backends for companies across Lebanon and the MENA region. If your PostgreSQL performance is blocking product velocity, we can help you diagnose the root cause and implement the right fix.
Voxire
SaaS Products
Building and running SaaS: Go and PostgreSQL, distributed systems, multi-tenancy, billing, observability, and the production engineering behind RTYLR. Written from shipping our own product, not from reading about it.
Learn more